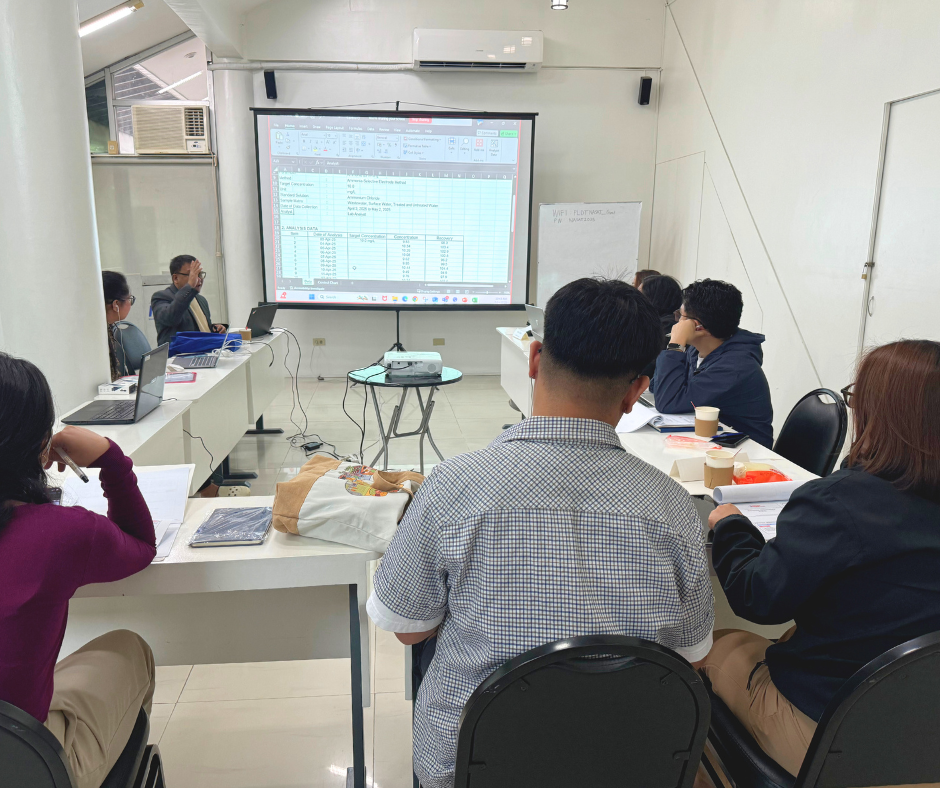
Part of the “QA/QC in Chemical Laboratories” series, this course focuses on using quality control charts to assess and improve laboratory operations through statistical and graphical methods. Participants will learn how to select appropriate chart types, plot and interpret data, and respond to out-of-control conditions. Practical application using real lab data and statistical software is emphasized.


